Original data I have collected, web-scraped or obtained from national authorities in the course of my research. Most of it is not openly published, so I share it as a public good with researchers and master's students, on request.
Requesting is deliberately a conversation rather than a download link: each of these datasets carries assumptions about how it was assembled that determine what it can and cannot be used for, and I would rather explain them than have the data used in ways it does not support. Write to me with a short note on what you have in mind — I'd be happy to help and guide :)
Asking for any of them
- 01
School Censuses of Nigeria and Senegal
Nigeria · Senegal — pre-primary through secondary
Two national school registers assembled for my work on secondary school expansion in West Africa: a complete web-scrape of the Nigerian school management system, geocoded to the individual school, and a Ministry of Education census for Senegal.- 160,615 schools listed
- 133,428 geocoded points
- ~41.7m pupil enrolments
- 1801–2024 founding years
Nigeria
141,663 schools, geocoded to the individual school
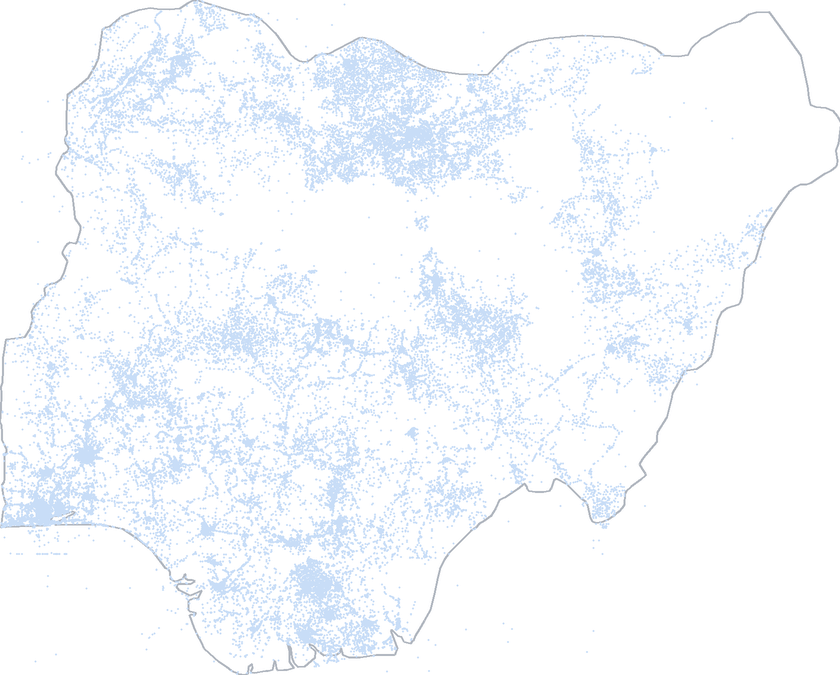
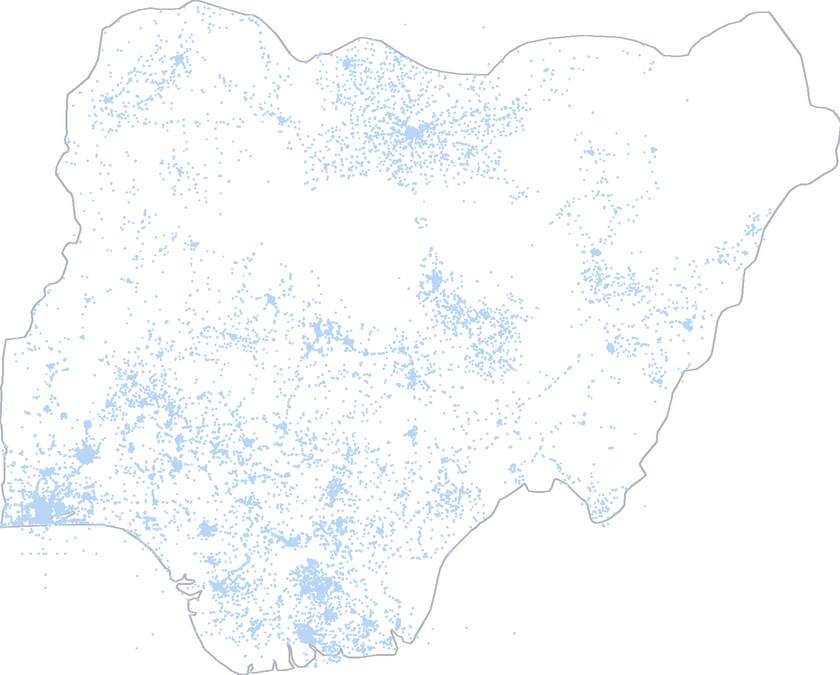
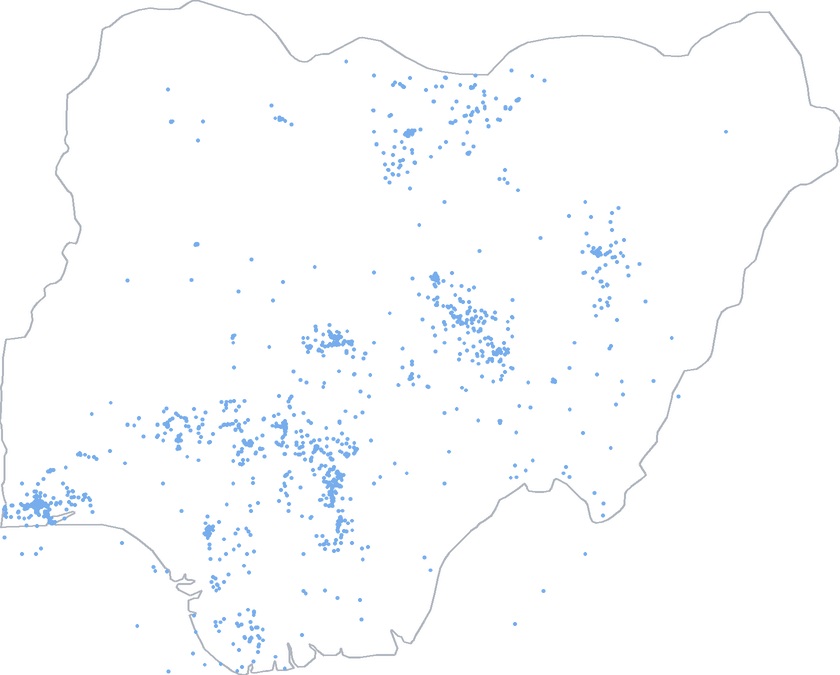
Every school listed in the national register, each with a unique code, name, state, LGA, level, sector and year of establishment. 133,428 carry point coordinates that fall inside the country. The register spans 39 state entries and 670 local government areas, and splits 77,774 private against 63,889 public; founding years run from 1801 to 2024, with a median of 2006. Alongside it sit four enrolment tables — 204,090 school records and roughly 41.7 million pupil enrolments, broken down by grade and by sex from ECCD and nursery through to SS3, each with sector and an urban/rural marker.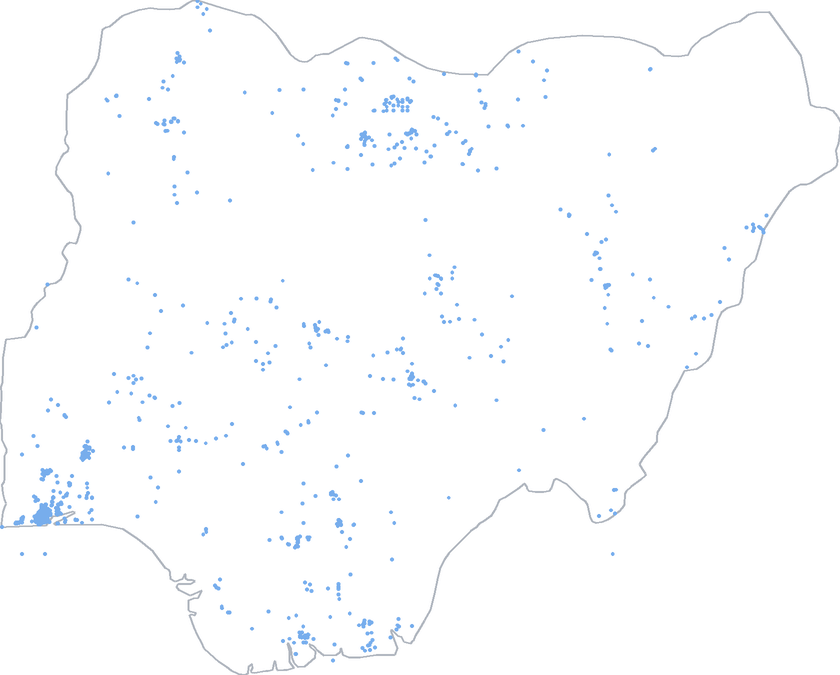
Pre-Primary
1,106
Primary
105,894
Junior Secondary
31,421
Senior Secondary
3,242
CollectionWeb-scraped from NEMIS, the national education management information system, with Javier Martínez. That site is only intermittently available; the scrape captured every school listed during a window when it was running reliably.
Senegal
18,952 establishments from the Ministry of Education register
16,297 primary and 2,655 secondary establishments, each with its administrative code, region, department, inspectorate and commune, public / private / community status, teaching cycle, an urban/rural marker and a founding year — 1822 to 2024 for primary, 1886 to 2024 for secondary. Coverage is national: 14 regions, 47 departments and roughly 550 communes.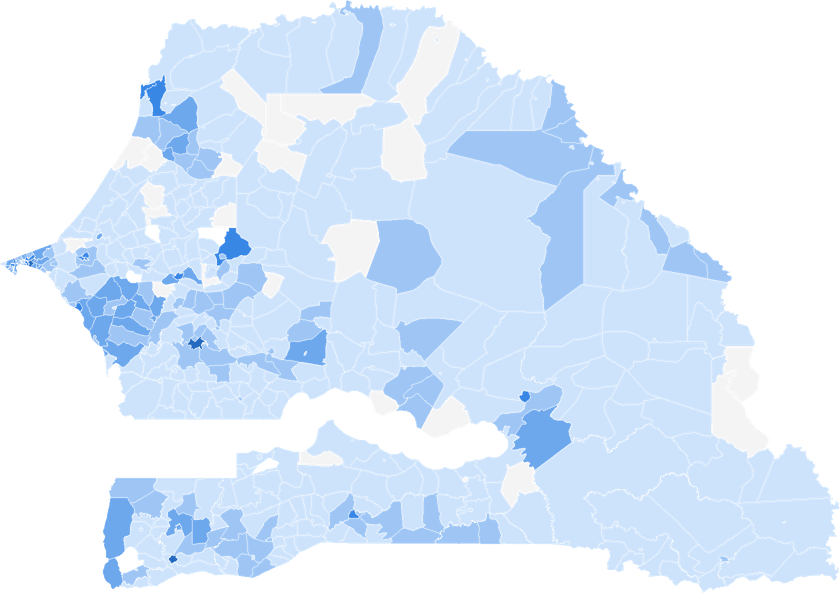
Petite enfance
5,116
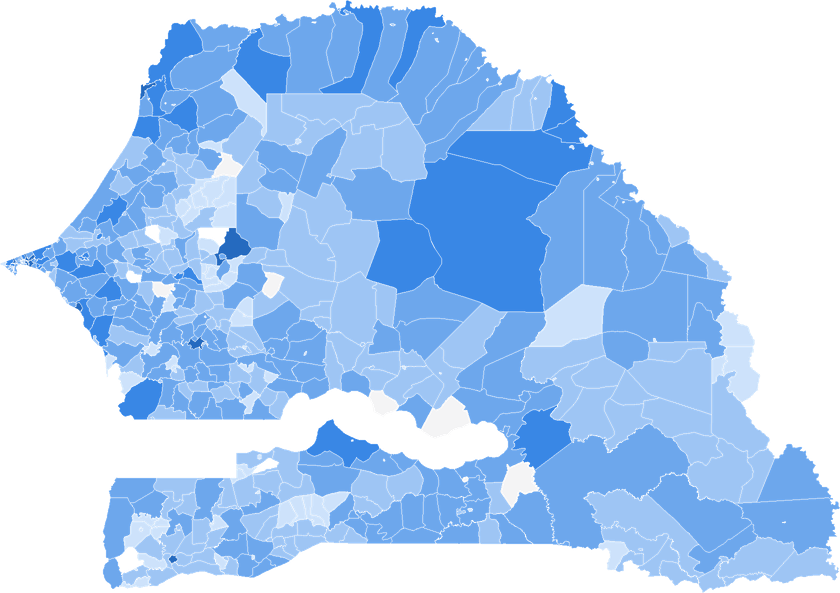
Primaire
11,181
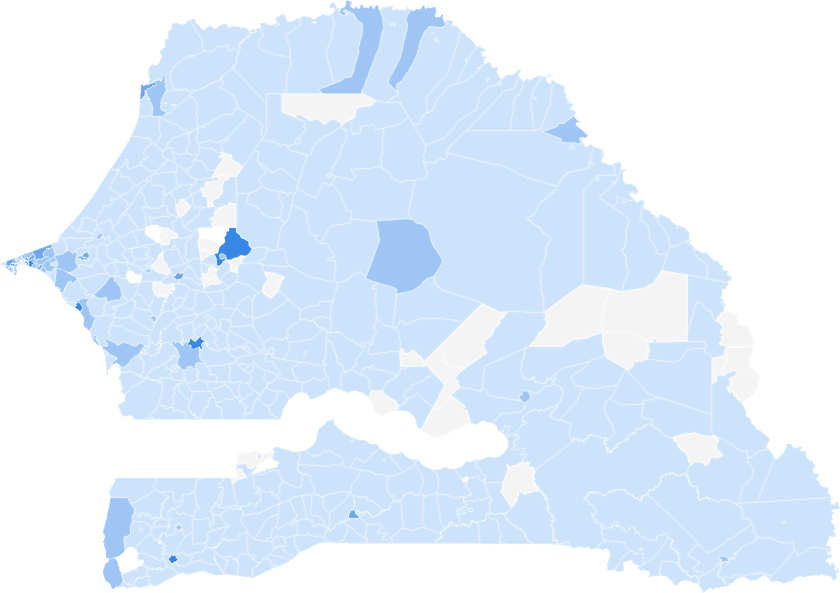
Moyen & secondaire
2,655
Schools per commune- 1–9
- 10–19
- 20–39
- 40–79
- 80+
CollectionObtained directly from officials at the Ministry of Education. Access to the Senegalese census is subject to their agreement, so a request for it is passed on to the Ministry rather than granted directly. Commune boundaries from OpenStreetMap (ODbL).
Both are still in use in some of my ongoing papers.
- 02
Health Facility Register of Nigeria
Nigeria — hospitals and primary health care
The national register of Nigerian health facilities — every hospital and primary health care centre, public and private — cleaned, dated and geocoded, including 4,391 facilities I placed on the map myself where the register gave no coordinates.- 42,063 facilities listed
- 41,323 mapped points
- 4,391 coordinates I added
- 1901–2024 opening years
Every facility on the national register, each with a unique code, its state, local government area and ward, ownership, level of care and the date it opened — coverage is complete, all 37 states and all 774 local government areas, across 9,566 wards. 30,773 facilities are public and 11,290 private; 35,903 are primary health care centres and 6,160 are hospitals, of which 6,002 are secondary and 158 tertiary. 40,021 were operational when the register was taken, the rest closed, temporarily closed or still under construction, and each carries its registration and licence status. 34,838 have an opening date recorded to the day, which is what makes the register usable as a panel rather than a snapshot: 34,469 facilities have both a plausible opening year and a point, and I keep that subset as a separate file.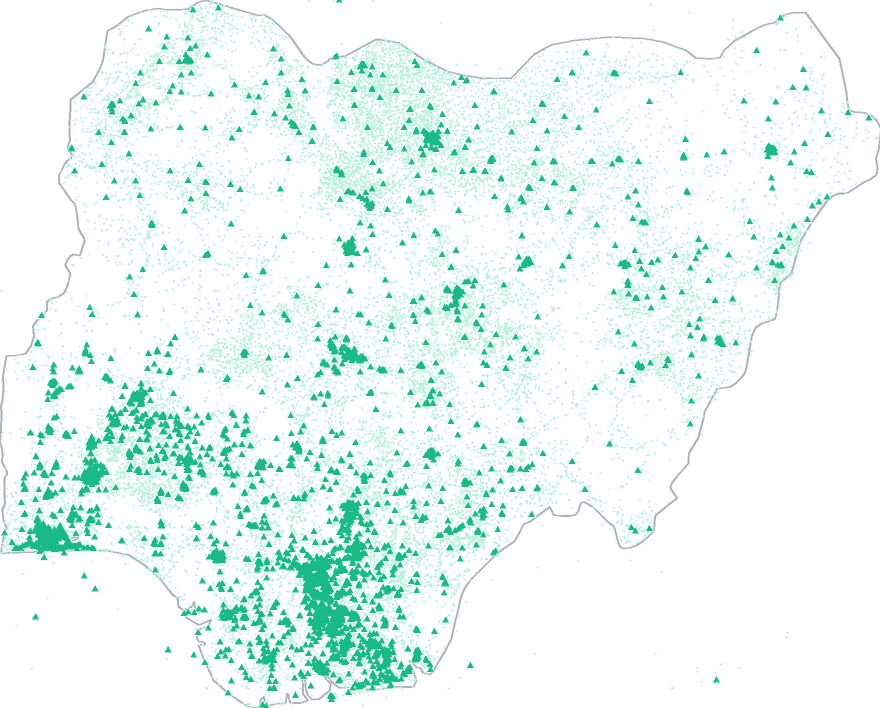 Mapped facilities
- Primary health care (35,324)
- Hospital (5,999)
CollectionDownloaded from the Federal Ministry of Health’s Health Facility Registry site, which has since gone offline. About one facility in eight came with no coordinate, and I geocoded those myself in R through Google Maps and OpenStreetMap, recovering 4,391 of them. A flag in the data marks which points came from that pass.
It is the backbone of my ongoing work on health facility expansion and fertility in Nigeria.
- 03
Crime-Reduction Policing in Chile
Chile — municipality (comuna) level, 1994–2022
Municipality-level records of the two policing programmes Chile used against crime: Plan Cuadrante, the beat-policing reform Carabineros rolled out from 2000, and the patrol corps municipalities set up themselves, assembled one Transparency Portal request at a time.- 345 municipalities covered
- 150 under Plan Cuadrante
- 189 with their own patrols
- 1994–2022 years covered
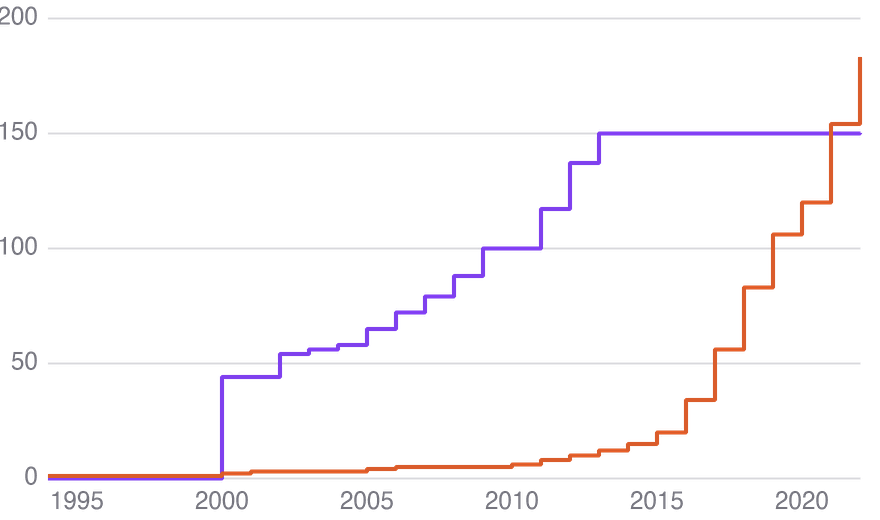 Municipalities covered
- Plan Cuadrante (150 by 2013)
- Seguridad Ciudadana (183 by 2022)
Plan Cuadrante
150 municipalities, staggered entry 2000–2013
Plan Cuadrante de Seguridad Preventiva is a beat-policing reform run by Carabineros de Chile: urban municipalities are cut into small quadrants and officers are assigned permanently to one of them rather than rotating across the whole municipality, the aim being to reduce both crime and the fear of it. Begun in 1998, it reached municipalities in waves — 44 in the first year of this record, then a steady spread until the last 13 arrived in 2013. That staggered entry is what makes the file useful: it is the treatment timing behind Boots in the Beat, where we use it to estimate the reform’s effects on victimisation and crime perception. Alongside the entry dates sits a companion workbook flagging which municipalities appear in the national victimisation survey and which untreated municipalities border a treated one.CollectionThe entry dates were provided directly by Carabineros de Chile, whose own records are the only authoritative source for them.
Seguridad Ciudadana
345 municipalities × 20 years of municipal patrol programmes
Where Plan Cuadrante changed how national police officers were deployed, Seguridad Ciudadana programmes are the municipalities’ own: locally funded patrol corps that attack crime by adding policing resources on the ground. The panel runs 2003 to 2022 for all 345 municipalities and records whether each one runs such a corps and from what year — 189 do, with start years from 1994 to 2022 that cluster heavily after 2016 — along with the same questions asked about Plan Cuadrante, 2021 population and density, and a reliability grade for each municipality’s answers, of which 261 are complete. It also carries patrol staffing year by year: 530 municipality-years with officers on the books across 179 municipalities, a median corps of 6 and a largest of 141. The wider workbook behind it holds the same for municipal inspectors in 127 municipalities.CollectionCollected municipality by municipality through the Chilean Transparency Portal, which obliges public bodies to answer requests for their own records — 340 of the 345 came that way, the rest from municipal websites. Every figure is self-reported by the municipality that answered, which is why a reliability grade travels with each one.
Together they cover two very different eras of Chilean crime policy, and both are in use in my ongoing work.